Stef Smits' in-depth review of the JMP 2021 data on the progress made in 15 countries and discussing the implications towards 2030.
Published on: 12/01/2022
When the Sustainable Development Goals (SDGs) were announced in 2015, at IRC we spoke about ’15 years to make history, 5 years to make change’. The argument was that in order to achieve the SDGs in 15 years from then, the first 5 years would be crucial. That is the time it would take to get the sector’s system geared up for accelerating towards delivering universal access. With the publishing of the 2021 JMP report in July last year, we got the first insight into whether the sector has made changes, and whether it is ready for the next 10 years of the future. The headline message of the report is that good progress is being made, but that it is insufficient to meet the 2030 targets. For that, the rate of progress needs to quadruple globally, and multiply by a manifold of that in certain groups of countries.
In this blog I build on those headline messages and review the changes countries have undergone in the past years, and discuss the implications for the coming 10 years. I do so by zooming in to the 15 countries in which IRC and its strategic partner Water For People have presence: Bolivia, Guatemala, Honduras, Nicaragua and Peru in Latin America; Burkina Faso, Ethiopia, Ghana, Malawi, Mali, Niger, Rwanda and Uganda in Africa; and, Bangladesh and India in South Asia. They are the countries to which we are committed as part of Destination 2030 (D30), our joint vision for the sector for 2030, and the strategy towards that vision. These 15 countries are from different (sub)regions and income groups. And I believe them to be illustrative of the various water and sanitation situations found across the globe.

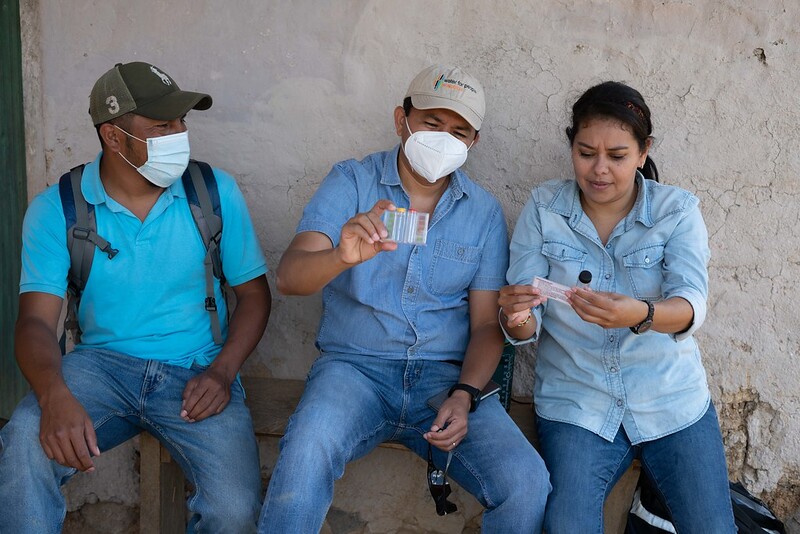
Making the step towards safely managed services implies a stronger focus on water quality. Photo by © Elias Assaf
The 5 Latin American (Figure 1 in the Annex) and 2 South Asian (Figure 3) countries show a very similar situation with respect to drinking water supply: very high levels of access (of around 90%), and where data is available around 50% of access to safely managed services. Among the African countries (Figure 2) there is more diversity in terms of access. Access levels in Ghana and Mali are just a bit below the ones in South Asia and Latin America. But in the other countries, levels of access are significantly lower, between 40% and 60%. And safely managed services are enjoyed only by very minor percentages of the population.
Levels of access to basic sanitation are 10-20 percentage-points below access to basic water supply in the Latin American countries and India (see Figure 4 and Figure 6). But what stands out above all are the very low levels of access (around 20%) in most African countries (Figure 5). However, a closer look at the data reveals very different situations with respect to the types of sanitation between the countries. Burkina Faso and Niger have a majority of their population still practising open defecation; in Ethiopia, Malawi and Uganda a majority uses unimproved sanitation; and in Ghana, a large share of the population uses limited (shared) toilets. This means that across these countries there are very different levels of demand for sanitation, and probably need for different approaches to move forward on at least basic services.
The JMP report and accompanying database contains data on the percentages of the population having access to water and sanitation that meet criteria of elements of safely managed services. Below, we present those data, but as percentage of population that have improved services. This gives better insight into which aspects of safely managed services are more commonly met, and which ones not.
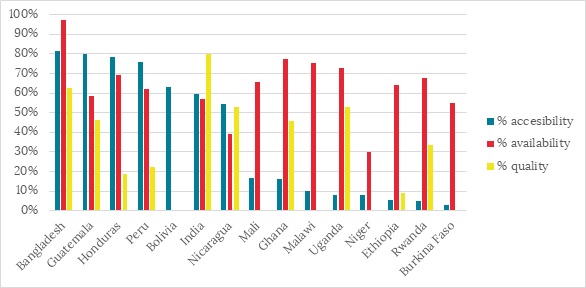
For water supply, I have taken only the rural population as the differences are the most striking there and where safely managed services are less common. As can be seen in Figure 1, there is a marked difference again between the Latin American and South Asian countries on the one hand, and the African ones on the other. In Latin America and South Asia, accessibility is the element of safely managed services that is most commonly enjoyed. In other words, it is the least limiting factor. In the African countries, it is the element of safely managed that is least enjoyed. This has all to do with the technologies employed. In Latin America, and increasingly in India, piped supplies with household connections are the standard, also in rural areas. In most African countries, boreholes with handpumps, and to some extent piped supplies with communal standpipes, are the common forms of rural water supply. For the African countries to progress on safely managed services, moving towards supplies on premises is therefore key – also because on the factors of availability and water quality the African countries perform at a similar level as countries from the other regions.

Figure 1: Percentage of rural population with access to improved water supply, meeting elements of safely managed
The situation with respect to safely managed sanitation yields a different picture. First of all, there is also a marked difference there in terms of technologies. The Latin American and South Asian countries see a mix between sewers, septic tanks and latrines. In some countries, such as Peru, even a large part of the rural population uses latrines. In the African countries, latrines form more or less the only sanitation option, with small percentages of septic tanks, and negligible percentages of sewers.

Figure 2: Percentage of population with access to improved sanitation through different technology options
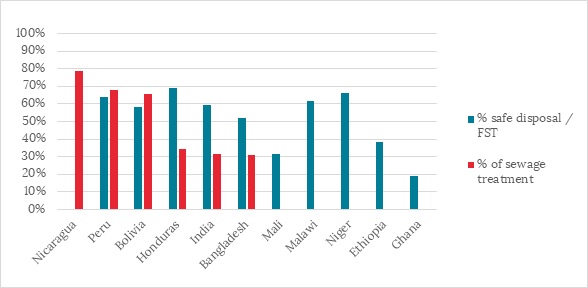
The extent to which these technologies lead to safely managed services is presented below. It shows the percentages of people with sewers whose sewage is treated adequately, and the percentage of people with latrines and septic tanks, that either practise safe disposal in situ, or have the faecal sludge managed adequately. It shows reasonably high levels of wastewater treatment in three Latin American countries, and low levels of treatment in Honduras and the two South Asian countries. Safe disposal and/or faecal sludge treatment fluctuates around 60%.

Figure 3: Percentage of population with access to certain technologies, that also meet safely managed criteria
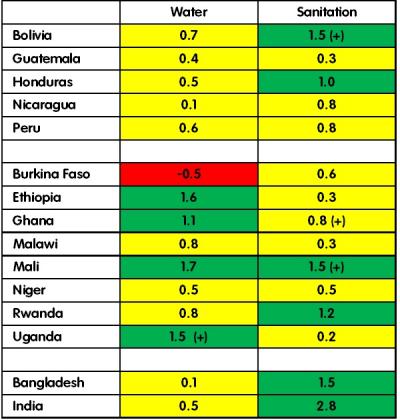
Whereas the figures above describe the current levels of access, this section explores the past, how the countries got there. To test whether there have been 5 years of change, ideally, I would have to plot the rate of progress over the past 5 years only. However, such data is not available, as the JMP calculates the rates of change using a linear regression analysis over the entire period of 2000-2020, and not for five-year periods within that. So, I have compiled the rates of change from the JMP database (see Table 1). Rates of change of more than 1 percentage-point per year are indicated in green as they can be considered high (only 10% of countries and territories had rates of change higher than that for water, and 18% for sanitation). Moderate rates of change of less than 1 percentage-point per year are indicated in yellow, and negative rates of change in red.
In addition, I have looked into whether countries appear to be accelerating, using the methodology explained in this blog, based on data from the previous JMP report. These are countries where data from the last 5 years indicate that the rate of change is increasing, indicated in the table below by a plus sign in parenthesis. As mentioned in that blog, the appearance of acceleration needs to be treated with caution, and requires a more detailed analysis of the country-specific data.
Table 1: Rates of change in access to at least basic water and sanitation (percentage-point/year)

In the countries in Latin America, the annual increase in access to water supply is moderate or low. That is understandable as the levels of access are already high. In two of the countries the rates of change in sanitation are high, and one of them appears to be accelerating: Bolivia. Bolivia was already identified in my blog on the previous JMP report as a country appearing to accelerate, particularly in rural areas. The new datafile shows that this acceleration has continued. Since about 2015, the data points are all well-above the original regression line.
The rates of change in the African countries yield a mixed picture. Some countries have been increasing access at a high rate for water only (Ethiopia and Uganda), sanitation only (Rwanda) and both water and sanitation (Mali). Mali appears to even be accelerating its access to basic sanitation. A deeper look into the country sheet shows a similar pattern as Bolivia, with a number of datapoints since 2015 being well above the original regression line. However, Mali has very few datapoints from the period 2000-2010. This means that there may not be a real acceleration happening, but that this is merely a statistical effect of having more recent data. In my previous blog, Uganda was identified as a country undergoing acceleration in its rural water sector. The data from the 2021 JMP report confirm that acceleration appears to be happening. This is explained above all by the fact that there are various datapoints since 2015 which put the percentage of people (in rural areas) that live within a 30 minute roundtrip higher than earlier datapoints. In Burkina Faso the opposite happens. It is the only country among these 15, in which access to at least basic services has actually gone down. A more detailed look into the Burkina Faso data reveals that access to improved services has actually gone up, but to at least basic services has gone down. This can be explained by the fact that more and more people have to take a more than 30 minute roundtrip. Or in other words: more people have access, but also disproportionally more people have to take a longer trip to fetch the water.
For the two South Asian countries the high rates of change in sanitation stand out, particularly the 2.8 percentage-points per year of India. Since 2015, the data on access to sanitation show a remarkable increase, probably as a result of the Swachh Bharat campaign. In the table, however, it is not indicated as 'appearing to accelerate' as it seems that the increase already started a bit before 2015. But Swachh Bharat has surely contributed to that acceleration.
By making linear extrapolations of these rates of growth from the current levels of access yields the projected levels of access in 10 years from now, by 2030, both for at least basic and safely managed services. Universal access (more than 99%) is indicated by dark green, high access (more than 90%) by light green, moderate access (more than 75%) by yellow, and low access (less than 75%) by orange. For safely managed, I use dark green to indicate more than 60% access, light green more than 40%, yellow more than 20%, orange below 20%. Moreover, I indicate whether the rate of growth is high (indicated by +), or negative (indicated by -); the ones without indication have a moderate rate of growth.
Table 2: Projected levels of access to at least basic and safely managed services in 2030

Apart from Nicaragua, the Latin American countries are projected to achieve all but universal access to at least basic water services, of which some 50-60% through safely managed supplies. They are projected to achieve that, even without having high rates of growth. In essence, if they continue what they have been doing they will achieve universal access. For sanitation, the picture is less rosy. Only Honduras is projected to get to high levels of access. And Bolivia, in spite of having a high rate of growth, and appearing to accelerate, would only reach some 81% access. Bolivia and Peru are the only two countries with projections for safely managed services, and both are expected to reach reasonably high percentages of safely managed sanitation.
Among the African countries, only Ghana and Mali are projected to reach close to universal access for water supply, if they keep up their current high rates of change. Ghana is the only country projected to reach a reasonable level of safely managed water supply services. In spite of the high rates of change, countries like Ethiopia, Rwanda and Uganda will still only end up with low to moderate levels of access to water supply and sanitation. They are performing well, but the gap is simply too big. Particularly worrying is the projection for sanitation. Apart from Mali and Rwanda, none of the countries is projected to reach more than 40% access to at least basic services. Safely managed water and sanitation are projected to remain low to moderate in all countries.
Similarly to the Latin American countries, Bangladesh and India are projected to reach close to universal access for water supply. India is also projected to reach universal access to basic sanitation if it maintains the current high rates of growth, and even a high level of safely managed sanitation. Bangladesh also has a high rate of growth in sanitation, but it will still only reach 69% access to basic sanitation.
This review shows that some of the reviewed countries have undergone change – or at least appear to have done so – in order to accelerate progress in terms of water and/or sanitation. These include Bolivia (sanitation), Mali (sanitation) and Uganda (water). Other countries had less of a need for change as they already had high levels of growth and they maintained those (e.g. the South Asian countries for sanitation), or were projected to reach universal access anyway, in spite of moderate levels of growth (some of the Latin American countries for the water sector). So, though change has happened only to a limited extent, several countries are still projected to perform well in the years ahead.
But this analysis has also shown a number of other trends that these, and other countries, need to engage with:
I hope that by digging into five years of data, countries are able to set ambitious, but more differentiated, targets for the water and sanitation sector, and use those data as well to come up with strategies to reach those targets.
At IRC we have strong opinions and we value honest and frank discussion, so you won't be surprised to hear that not all the opinions on this site represent our official policy.