Using real data, we look at how the WASHCost calculator can be used in practice in India.
Published on: 06/01/2014
This is a depiction of how someone can use the advanced tool of the WASHCost Calculator. The example input data come from the real dataset collected by the WASHCost project in India (see link below).

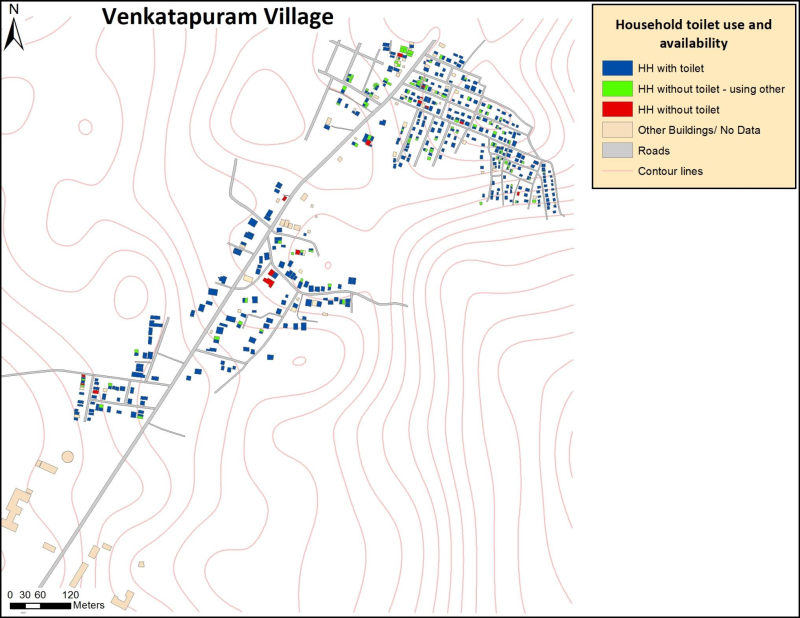
Ravi Kumar, Junior Engineer working at the Block level is concerned about maintaining the Open Defecation Free (ODF) status awarded to Venkatapuram. He wants to know if households and government are spending enough on sanitation services to maintain this status and to have a sanitation service report on finance that he can share with stakeholders.
Ravi starts by providing some contextual information about the village, its location, the population density and who is responsible for the various aspects of sanitation services. Households take care of most aspects of their facilities and the maintenance of the sanitation service. Adding this information to the WASHCost Calculator report page will help Ravi communicate the financial sustainability of sanitation services. The data also includes some information about household income and size.
| What is the average annual household income in the service area? | ₹ 60,256 |
| Average household size | 4 |
Several technologies can be defined in a service area in the tool. Venkatapuram has only one type of latrine. The junior engineer uses the technology screen to start to define the technologies used. First, by selecting the Pour Flush Latrine.
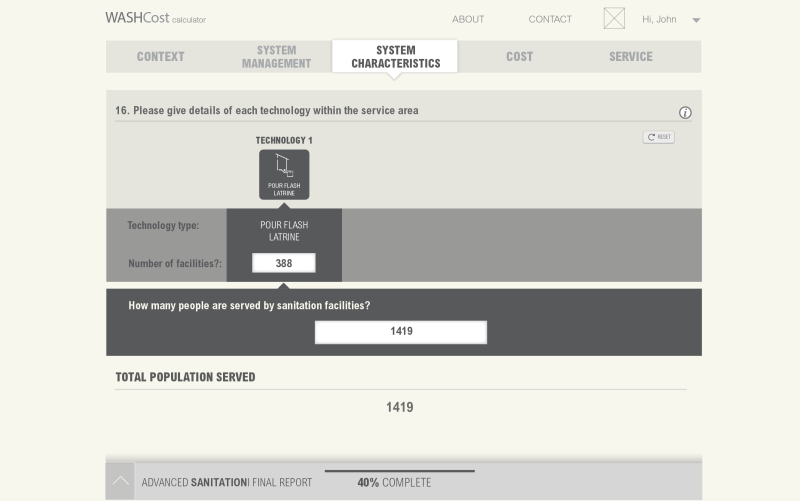
Some additional details can be filled in to differentiate between pour flush latrines. In this example, the latrines share the same characteristics. For example, there were no double pit latrines.
| Type of slab | Cement |
| Ventilation pipe | Yes |
| Pit lining | Concrete rings |
| Water seal | Yes |
| Number of pits | 1 |
| Superstructure | Corrugated metal sheet |
| Septic tank | No |
| Connected to sewerage system | No |
| Urine diversion system | No |
| Sludge treatment | No |
The junior engineer knows that in total, ₹ 3,015,342 was spent on constructing latrines in Venkatapuram. Unfortunately, he does not know what was spent on software costs.
Split up over the different components of the latrine, the investment was:
| Component | Currency (year) | Expenditure | Estimated lifespan |
| Pit | ₹ (2011) | ₹ 502,557 | 6 |
| Superstructure | ₹ (2011) | ₹ 1,340,152 | 15 |
| Lining | ₹ (2011) | ₹ 1,172,633 | 15 |
| Treatment and disposal | ₹ (2011) | Don’t know | |
| Other: | ₹ (2011) | ||
| Software costs | ₹ (2011) | Don’t know | |
| Sub – total | ₹ (2011) | ₹ 3,015,342 |
Ravi made educated guesses about the lifespans of each component.
From WASHCost, Ravi knows what the households are spending each year on operation and minor maintenance of their facilities, e.g. cleaning and materials. However, he does not how much households have spent to empty the pits, how often that happens and is not aware of any loans that have been taken out to construct the facilities.
| What has been/will be the minor operation and maintenance expenditure per year for all facilities combined? | ₹ (2011) | ₹ 85,748 per year |
| What has been spent/will be spent on capital maintenance expenditure per year for all facilities combined? | ₹ (2011) | Don’t know |
| What is the cost of servicing any loans taken to fund the service per year for all facilities combined? | ₹ (2011) | Don’t know |
| What is the payback period on this loan? | ₹ (2011) | NA |
| Total recurrent costs – Pour flush latrine | ₹ (2011) | ₹ 85,748 per year |
In addition, there are some costs that are not related to households. There are costs for local governments to provide support to households and manage the subsidies (direct support) and there are costs related to the overall government administration and policy making that are required for the support of sanitation services (indirect support). These support costs were investigated by WASHCost in Andhra Pradesh and were found to be:
| What has been spent/will be spent on expenditure on direct support? | ₹ (2011) | ₹ 13.72 per person per year |
| What has been/will be the expenditure on indirect support? | ₹ (2011) | ₹ 2.29 per person per year |
In the tool, Ravi can divide the up the households by the level of service that they are receiving. The WASHCost Calculator allows different types of households services by their accessibility, use, reliability (maintenance), and environmental protection. Ravi has data for all of these except environmental protection.
21% of households have achieved the best service in the village since everyone in the household uses the latrine, although the latrine is inconsistently cleaned. So the junior engineer defines the service like this:
| Accessibility | Are latrines provided at the household level? | Yes |
| Accessibility | Does the latrine have an impermeable slab? | Yes |
| Accessibility | Does the service accessibility meet the national norms? | Yes |
| Use | Which family members use the latrine? | All |
| Use | Does the service use meet the national norms? | Yes |
| Reliability | Is the latrine clean and emptied? | Not consistently |
| Reliability | Does the service reliability meet the national norms? | Yes |
| Environmental Protection | What is the environmental impact of sludge disposal? | No data |
| Environmental Protection | Does the service environmental protection meet the national norms? | No data |
71% have achieved a good level of service but the difference is not everyone in the household uses the latrine and 8% of households have no household level toilet so cannot be considered to have access to a sanitation service. Ravi inputs each of these into the WASHCost Calculator service level screen.
At this point, Junior Engineer Ravi Kumar can generate a report including a financial analysis of Venkatapuram based on the data he entered in the calculator.
Ravi is concerned about maintaining the Open Defecation Free (ODF) status awarded to Venkatapuram and wants to know if households and government are spending enough on sanitation services.
Upon finishing the inputs, Ravi generates a nicely formatted report that can be shared with stakeholders.
The report provides a quick overview that Ravi can discuss with stakeholders first. He can bring up issues like missing data and try to fill in the gaps. In addition, over the long term, affordability may be an issue (more on this later). Finally, the junior engineer also has the chance to say what exactly the town has achieved in terms of service levels and at what cost.
Based on the inputs provided (see the previous blog post above), these are the results:
Expenditure
Service level
| Service level | Percentage served |
| Meets national norms | 92% |
| Does not meet national norms | 8% |
| WASHCost service level | Percentage served |
| Improved service | 0% |
| Basic service | 92% |
| Limited service | 0% |
| No service | 8% |
The potential expenditure shortfall may put these services at risk.
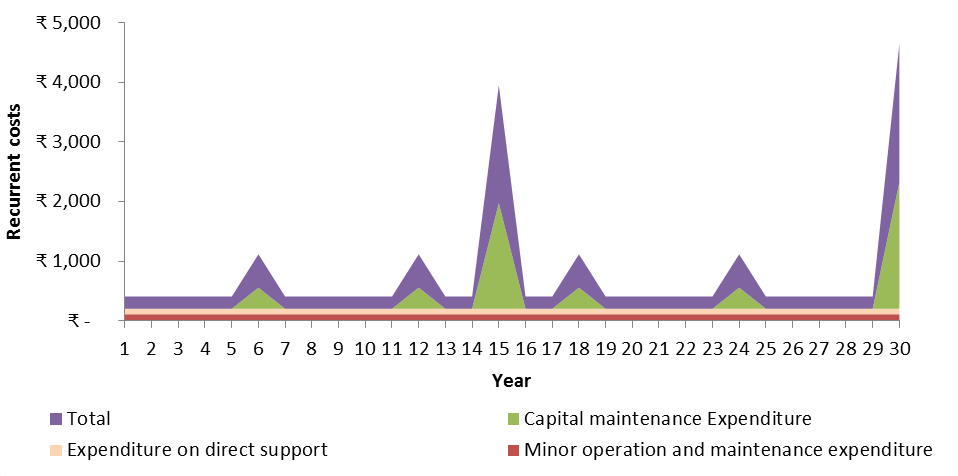
In this section, Ravi gets an overview of the financial analysis. Based on inputs, the cost of establishing facilities and services is ₹ 3,015,342. The cost of maintaining those services over 30 years is ₹ 3,253,986 according to the inputted expenditure. However, estimated costs indicate that this too low.
The graph below shows costs estimated over 30 years. The minor operation and minor maintenance expenditure and expenditure on direct support are taken from the WASHCost benchmarks. The capital maintenance expenditure is based on the inputted capital expenditure and the lifespans of your facilities. When the life of a component comes to an end, it must be replaced and incurs a cost.
| Per person per year | Operational exenditure | Capital Maintenance Expenditure | Expenditure on Direct Support | Total |
| Inputted expenditure | ₹ 60.43 | ₹ 0 | ₹ 13.72 | ₹ 74.15 |
| Estimated expenditure | ₹ 114.00 | ₹ 177.08 | ₹ 91.00 | ₹ 382.08 |
| Expenditure surplus/shortfall | ₹ -53.57 | ₹ -177.08 | ₹ -77.28 | ₹ -307.93 |
There is an estimated potential shortfall of ₹ 307.93 per person per year based on a comparison with the WASHCost benchmarks and you capital expenditure. Missing data on software costs and capital expenditure may be affecting the results.
Based on the inputted values, the current level of expenditure appears to be affordable to households. However, based on the estimated level of expenditure over 30 years, there is some risk to affordability.
The total costs to finance operational expenditure, capital maintenance expenditure and the costs of capital equates to 0.4% of household income according to inputs. This is considered to be affordable.
It could be that the poorest households will still spend more than 2% of their income, which would be considered unaffordable. The official could try changing the income value to test the affordability for poorer households instead.
| Annual OpEx | Annual CapManEx | Total | Result | |
| Cost per household (inputted) | ₹ 241.71 | ₹ 0 | ₹ 241.71 | |
| Percentage of HH income (inputted) | 0.4% | 0.0% | 0.4% | Affordable based on inputs |
| Cost per household (estimated) | ₹ 456.00 | ₹ 708.33 | ₹ 1164.33 | |
| Percentage of HH income (estimated) | 0.8% | 1.2% | 1.49% | Some risk to affordability estimated |
This check assumes the households will be paying directly or through tariffs for the operation, capital maintenance, and costs of capital of the facilities.
The table below summarises the service level by indicator.
| Indicator | Service level | Percentage |
| Accessibility | Improved | 92% |
| Basic | 0% | |
| Limited | 0% | |
| No latrine | 8% | |
| Use | Improved | 21% |
| Basic | 71% | |
| Limited | 0% | |
| No latrine | 8% | |
| Reliability | Improved | 0% |
| Basic | 92% | |
| Limited | 0% | |
| No latrine | 8% | |
| Environmental protection | Improved | No data provided |
| Basic | No data provided | |
| Limited | No data provided | |
| No latrine | No data provided |
The Junior Engineer Ravi Kumar can now: