Prepare for life-cycle costs and service level data for sharing
Published on: 11/09/2014
Follow the WASHCost Share quick start guide (check the link below this article) if you have not yet registered a free account in the tool. Most users will want to use the tool to view shared reports.
This article will help advanced users to create new report in the tool and share those.
WARNING: Make sure you save your current report to the dashboard or save a share link before you work on a new report. Going to another report will replace any of your work.
You can always get to the report creation screen by clicking the WASHCost logo at the upper left hand side of the screen.

Advanced reports
To create an advanced report, you will need information about the service area.
To show the full report you will require:
Basic reports
To create a basic report, you will need some basic information about the service area:
TIP: Work with experts to generate and share the advanced reports before the basic report. Once an advanced report is saved, the dashboard will automatically provide the expenditure in the correct format (USD 2011) to create a basic report. At the moment (September 2014), only historical expenditures up to the year 2012 are converted to USD 2011.

This section focuses on the requirements for the advanced tool. The WASHCost Share tool inputs are divided up into three groups of questions about:
The WASHCost Share tool has ready-made templates for sharing data on:
Sources for the data may include implementation agencies, households and government are various sources and it is possible to use the tool to share data across these stakeholder groups.
The service area is the geographical region where the service using specified technologies takes place. Reports on the life-cycle costs of a service area are also best sub-divided into the socio-economic categories that have an impact on expenses. Higher income households are more likely to invest in more expensive technologies even when they provide a similar level of service.
The best way to do this in the tool is to create a report per social economic category in the geographical service area, e.g. "Ultra-poor using pour flush latrines in Bagherpara, Bangladesh" and "Non-poor using pour flush latrines in Bagherpara, Bangladesh".
While expenditure information usually comes from a number of different years and possibly in different currencies, these values must be brought to the same reference year before inputting in the calculator. In order to do this, you will need to identify the country in which the service takes place and the currency used in the report. The input currency for expenditure values should take into account the location of the service area and the reporting organisations. See below for more details on how to convert to a reference year. The tool requires that the country, currency and reference year ("year of expenditure") are defined for currency conversion to USD 2011 in the dashboard.
Expenditure on direct support and expenditure on indirect support are categories of life-cycle costs associated with the service area. See WASHCost briefing note 1a for more information. As these expenditure cover a large area, they must be entered in the tool as a per person per year value (per capita per annum), e.g. BDT 2.33 per person per year. Follow IRC's online training to learn more about these expenditures and estimating them for a service area. These expenditure values are required and should be filled in with 0 if the data is currently missing for all output calculations to display in the report.
There are a number of questions about the service area on who is involved in providing the services (households in the case of self-supply) and making expenses. These do not affect the outputs of the report.
The tool supports input on up to three types of technologies. Under each technology, you will provide information about the costs. Identify up to three the technologies used at the top of each column and their associated expenses below that.

Choose the closest technology option in the drop-down list. It is required to provide the number of facilities or systems installed for each technology, the number of people these systems were designed to serve, and the actual number of people served. It is possible, to fill in the same number of people for both values when information is missing. It is also necessary to define an estimated or ideal life-span for each technology in order to estimate future expenditure.
The expenditure questions include both capital expenditure to set up the technologies used and the services and the recurrent expenditure. In all cases these are the expenditure for all facilities and systems in the service area:
There is an optional question on whether unpaid labour or volunteer work has been used to setup the services.
Finally, the level of service should also be inputted and if there are specific standards in place for services, these should be understood and used to evaluate the service provided. By working together with households, service providers and the local authorities, much of this information can be straightforward to collect.
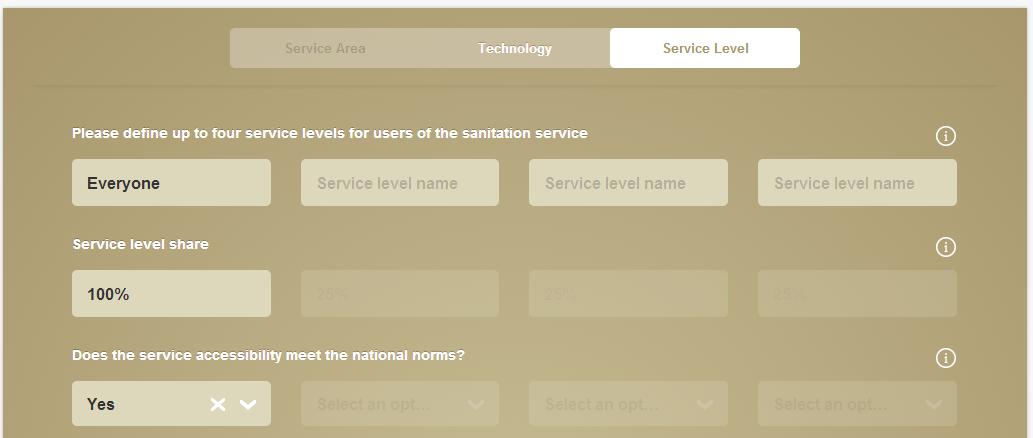
Currently, the area can be sub-divided into between 1 and 4 different levels of service. For each level of service, the proportion of the population receiving that service can be defined and that group named (for example, if it varies by neighbourhood).
TIP: Currently, the level of service is limited to four separately defined levels of service. These can be the most common level of service per income quartile for example or one per facility or household in a small population.
Before inputting expenditure, it is important to normalise your data. This requires reporting all values in the same currency and the same reference year or year of expenditure. In most cases, expenditure data will come from different years. You may use the associated spreadsheet "WASHCost Share Aide – currency conversion and averages" in order to convert data in a single currency but from different years to a reference year. It is important to do this before inputting the data into the WASHCost Share tool.