An urban sanitation diagnostic tool to identify bottlenecks in sanitation systems.
Published on: 08/11/2016
This blog has been written by Laura Schneegans and Erick Baetings
Billions of people lack sustainable and safe sanitation services. This has significant negative impact on human health, the environment and overall wellbeing of countries.
Ideally, the responsibility for sanitation services lies in the hands of local authorities or established utilities. But often the focus of these stakeholders is limited to sewered network systems that only serve a small proportion of the population. People may not be able to connect to municipal sewerage systems because they live outside the service range; cannot afford the service; or refuse to pay because they use another form of non-sewered sanitation system.
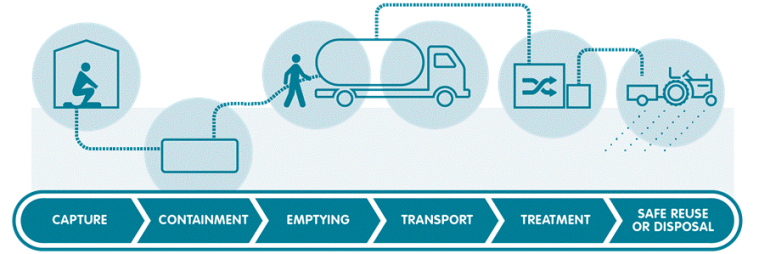
During my three-month internship at IRC, I have supported the sanitation team with the development of an urban sanitation diagnostic tool. The tool helps to assess the sanitation system holistically along the entire sanitation service chain. A simplification of the sanitation service chain is depicted in Figure 1.

The existing faecal sludge management assessment tool – also known as the faecal waste flow calculator – is a rapid assessment tool that results in a simple flow chart that illustrates faecal waste volumes along the entire sanitation chain. By depicting safely managed and unsafely managed waste flows, it gives a first impression of the chain elements which pose the greatest environmental burden and associated health risks.
This is a useful advocacy tool for capturing the broader picture. But when starting to consider possible solutions to resolve the major bottlenecks it is often necessary to gather more in-depth information. Therefore I developed an additional tool, the urban sanitation assessment tool.
The urban sanitation assessment tool is a diagnostic tool that captures the sanitation conditions in urban areas. Based on IRC's whole system approach the tool aims to support service authorities to cultivate a collective vision and identify strategic priorities for sanitation interventions. The tool helps to get a better understanding of the underlying constraints and opportunities for each element of the sanitation service chain.
The tool is shaped around the notion that sanitation interventions or plans for cities need to be based upon a deep understanding of the realities on the ground. Cities are not homogeneous places and services within are not uniform. They agglomerate a variety of existing sanitation systems and services, different income groups, unserved areas, and private properties within the service corridor. The condition and functionality of different types of sanitation services in different locations will have a strong impact on the options for improvement or service expansion. Therefore, any development of an intervention has to be well informed about the context, the actors involved and the interactions that are shaping the system.
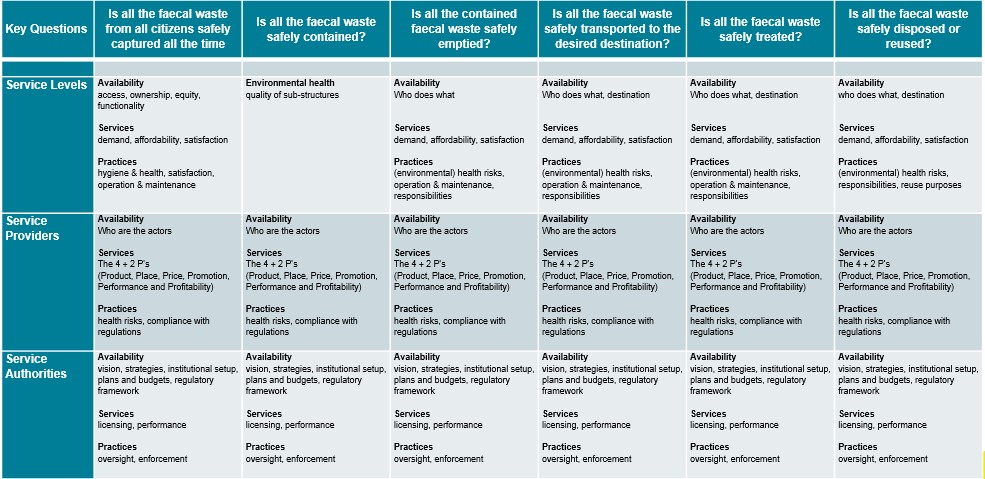
In order to understand the realities on the ground the tool takes three dimensions into consideration:
Thus, data required to feed the tool originates from multiple sources:
In that sense all actors are encouraged to participate and it helps to chart the complex relationships between the diverse range of operators, technologies, policies and legislation.
To display the efficiency of sanitation services in urban areas the tool will step by step focus on the six elements of the sanitation service chain. At each section of the chain a profile scan of actors involved is conducted that identifies available sanitation products, services and related practices and assesses their positioning on critical indicators such as affordability, consumer satisfaction, preferences, safety and regulations. In that sense the tool tries to develop a detailed profile of the chain actors, their roles inside the system as well as the constraints and opportunities of their operation.

To get the tool running primary data is required as it entails predefined questions for different indicators. The data can be collected with surveys, interviews, and observations. In addition, researchers will also have to examine secondary data (e.g. administrative data) that is routinely collected as part of the day-to-day operations of businesses, organisations and institutions.
Although the tool is still under construction, it is being designed as a universal solution that offers its users the possibility to get a more in-depth understanding of potential bottlenecks that keep sanitation chains from functioning. To showcase the bottlenecks among and across the sanitation chain elements scorecards (Figure 3) are built into the tool.
Every category contains building blocks that are assessed against specific indicator scores. The building blocks differ for each chain actor and are given a colour to indicate the current status and the extent to which remedial action is needed. In that sense the tool offers decision makers a first indication on where to set strategic priorities. The dashboard of the tool is still under construction. The aim is that the tool will display essential information in a user friendly and comprehensible manner.

At IRC we have strong opinions and we value honest and frank discussion, so you won't be surprised to hear that not all the opinions on this site represent our official policy.